Rotating Machinery PHM

Know it
before
it breaks

Reads vibration, current, and process values in real time to detect bearing defects and imbalance early. From sensors to dashboards, on a single platform.

Coolant Pump #1 · Drive-side Bearing Just now
Anomaly Score
7.6σ
Health
42
Vibration RMS
4.38mm/s
Diagnostic Alarms 3 Active
Suspected bearing impulsive defect 08:35
Excessive vibration · ISO 20816-3 Zone C 08:35
Bearing temperature rise 08:42
Pipeline

From Sensors to Dashboards

Each stage is independent, so the structure stays the same even with more machines.

01

Sensors

Capture status and operating conditions with vibration, current, and temperature.

02

Gateway

Extract only features with FFT on-site and upload them. Raw waveforms are kept separate.

03

Server

Judge immediately by specifications, and generate anomaly scores and forecasts with trained models.

04

Dashboard

Status, trends, health, and threshold reaching on a single screen. Alarms propagate from components to machines.

Diagnostics

The same 4.0 mm/s
is normal on one machine
and a failure on another

The vibration assessment method has changed three times. Because newer methods cannot fully replace older ones, all three are used together.

① Compare against specifications

Classifies severity by ISO 20816-3 zones (A/B/C/D). Usable from day one.

Limitation — Normal levels vary from machine to machine.

② Compare against the machine's own baseline

Sets the normal range as a baseline to see how many times the current value exceeds its own baseline.

Limitation — Only evaluates values individually.

③ Compare against trained normal conditions

Segments the intervals to learn multiple 'normal' patterns. If it does not fit any pattern, it is an anomaly.

The score is σ. By viewing multiple values together, it detects when a combination forms an unseen shape.

Learns from only normal data, without failure cases.

Platform

Finding it
is not the end

It tells you what changed, how much is left, and where to look first.

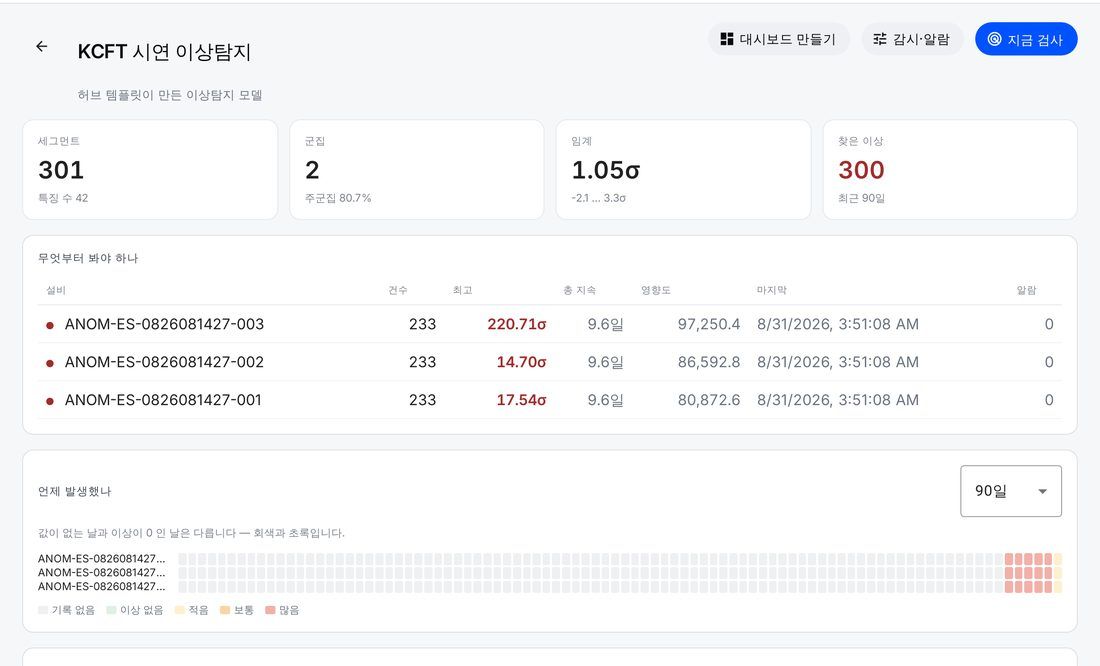
Anomaly Detection 화면 — 설비 순위표와 날짜별 발생 히트맵
Anomaly Detection

How many σ from normal?

It cuts data into segments to learn multiple normal patterns. It details which value deviated and by how much.
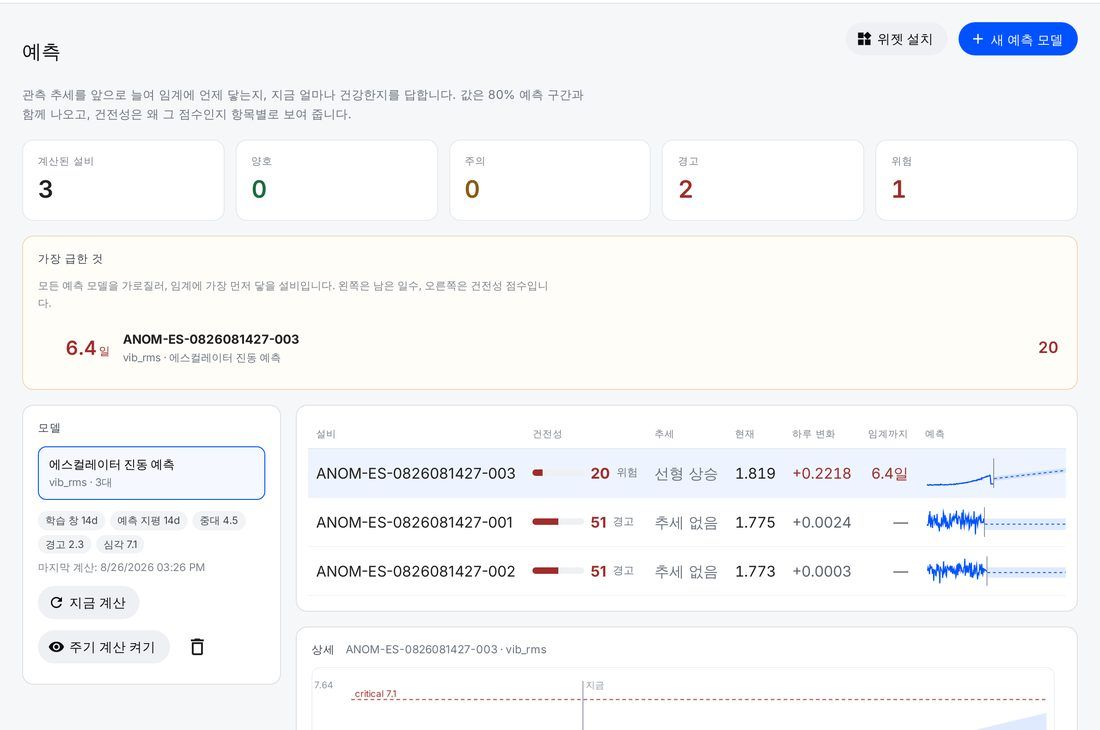
Forecast 화면 — 설비별 Health과 임계까지 남은 일수
Forecast

When will it reach the threshold?

It extends trends forward to calculate remaining days. If there is a cycle, it projects that pattern as well.
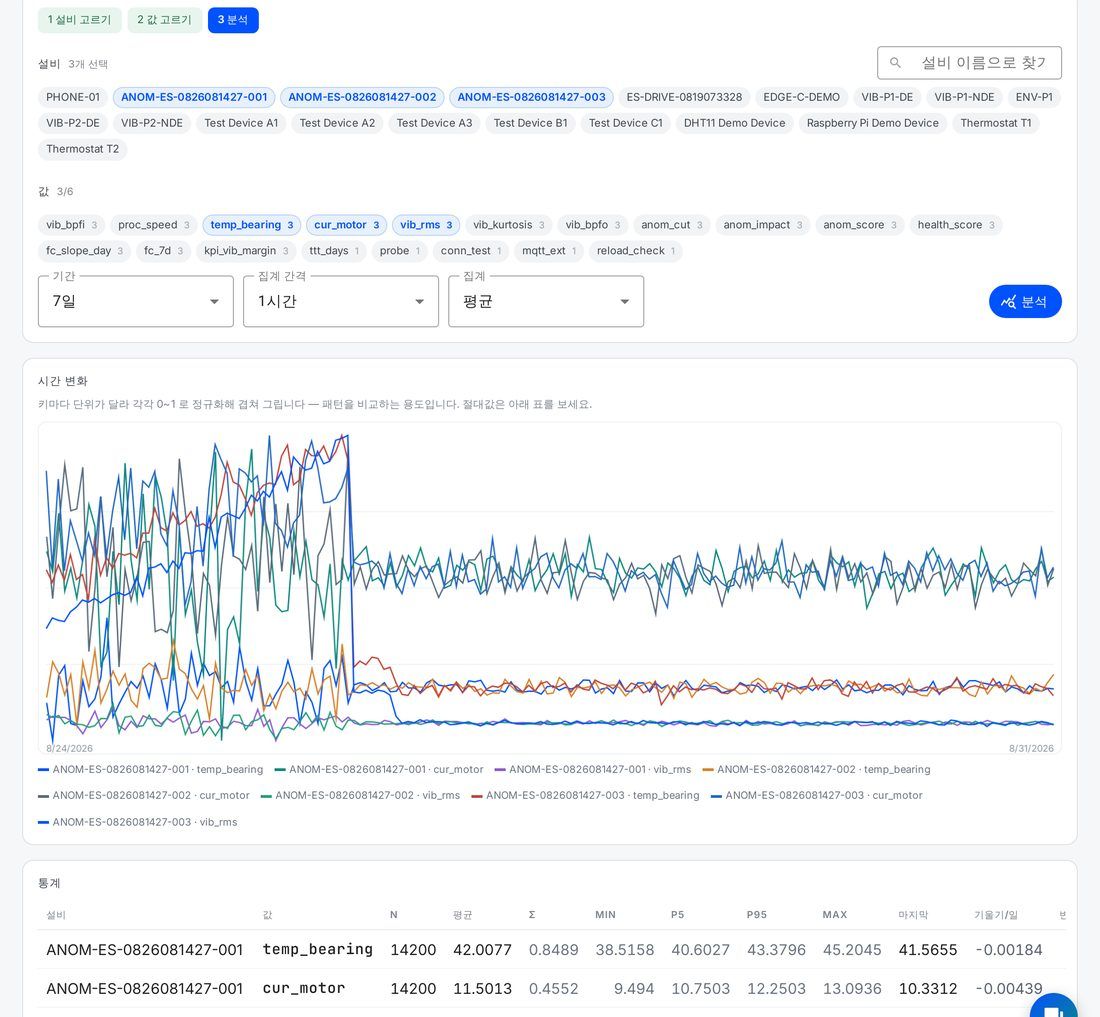
Data Explorer 화면 — 시간 변화 그래프와 통계표
Data Explorer

Explore the data first

See how values actually move without writing code. You can also just ask.
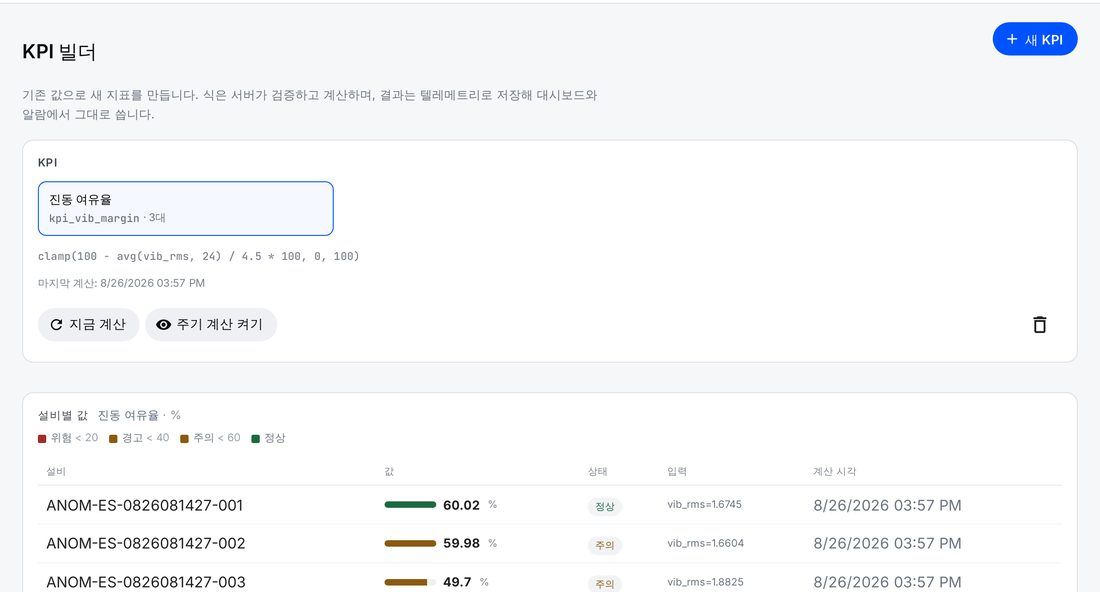
KPI Builder 화면 — 식으로 만든 Metric와 설비별 상태
KPI Builder

Create new metrics from existing values

Create with a single formula, save the result as telemetry, and use it directly in dashboards and alarms.
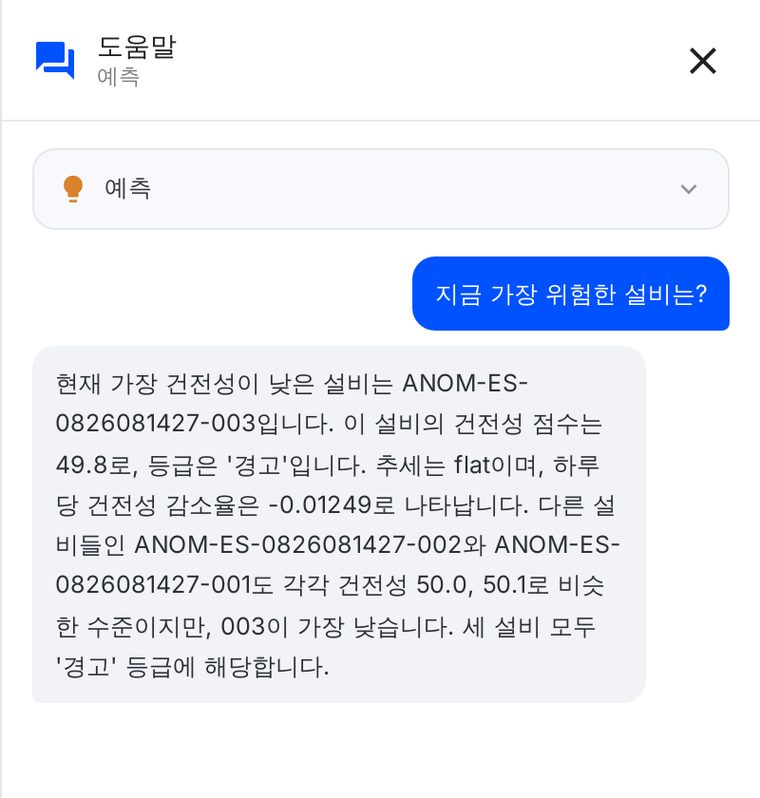
screen assistant — reads the values on the current screen to provide answers, and presents action buttons
Assistant & access

Ask, instruct, and build

Ask about the values currently in view. It shows the plan first, and only creates when you click.

Evidence

We checked it
with numbers

With predictive maintenance, you only know it failed long after the fact. That is why we built verification into the product. The numbers below are measured directly from public data and deployed code.

Even our mistakes are documented in the Diagnostics Methodology.

Verification Report

Each algorithm fails in different ways. That is why 8 algorithms assess independently, and we check how many agree. The values below compare only false alarms after achieving a 100% detection rate on the Paderborn bearing dataset.

Single Algorithm 10%
8-Algorithm Consensus 5%
Assessment MethodFalse Alarm · Detection
8-way consensus5%100%Adopted
Mahalanobis10%100%Single
kNN10%100%Single
Other Metrics2
Edge − Server Max Difference0.000087 σ
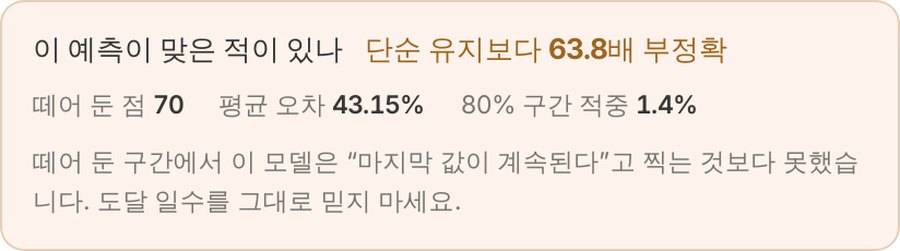
Forecast Post-ScoringHolding Out Last 25%
Forecast 화면의 사후 채점 — 이 모델은 단순 유지보다 63.8배 부정확했다고 표시
When a forecast misses, this is what appears on the screen.
Signals

What Values Are Read

These are the values actually used in rotating machine diagnostics. Raw waveforms are not uploaded.

MetricUnitWhat it indicates
vib_rmsmm/sOverall vibration severity — Judged based on ISO 20816-3
vib_kurtosisImpulsive signal — Sensitive to early bearing defects
vib_bpfogEnvelope outer race defect frequency component — Outer race damage
vib_bpfigInner race defect frequency component — Inner race damage
vib_ord_1xmm/s1X rotational frequency component — Unbalance
vib_ord_2xmm/s2X component — Misalignment (Judged by the ratio to 1X)
cur_motordBMotor current — Load variation · Rotor bar fault (sideband)
temp_bearing°CBearing temperature — Lubrication anomaly · Overload
4
UI and documentation language
8
Vibration and electrical features
4
Asset hierarchy
MQTT
CoAP · HTTP
Security · On-premises

Data never leaves
the factory

Everything from servers to inference runs within your internal network. There are no outbound paths in the design.

Inside the Corporate Network

The entire platform resides here.

  • Machine data · Vibration features · Raw waveforms
  • Diagnostic rules and alarm history
  • ML training data and inference server
  • Accounts · Permissions · Audit logs

Going Outside the Network

Nothing goes out.

  • External cloud transfer
  • Usage · Telemetry collection
  • Online license verification
  • Vendor remote access

Tenant isolation

Data is isolated per plant and site. Machines from other tenants cannot be queried at all.

Encryption in transit

Devices connect via MQTTS and CoAPS, and browsers connect via HTTPS. Devices are identified using gateway certificates.

Separate storage for raw waveforms

High-frequency raw waveforms are kept in a separate storage instead of the platform, with only reference keys uploaded. Query speed and retention policies are managed separately.

Frequently Asked Questions

Frequently asked

Do I need to purchase a separate analytics add-on like Trendz Analytics?
No separate subscription is required. However, Trendz currently offers broader capabilities for general-purpose charts and multivariate forecasting.
Can values that fluctuate by day and time, like usage, be forecasted?
Yes. It learns daily and weekly cycles to forecast future states. It distinguishes between daily fluctuations and actual degradation.
How can I verify if the forecast is accurate?
It holds back the last 25% of the training period for validation. If the prediction fails, the screen assistant warns you first not to trust the estimated days to failure.
How do I connect sensors?
Sensors can send data via MQTT, CoAP, or HTTP. If you are using an existing broker, simply connect the topics. Your control systems remain untouched.
Can I use ML without fault data for training?
Yes. It trains on normal data only, rather than failure cases. Even before that, ISO 20816-3 evaluation is active from day one.
If there are too many false alarms, the field will ignore them. How do you reduce them?
It filters in three steps. It raises only clear spec violations, discards momentary spikes using duration conditions, and groups repeated alerts to prevent flooding.
Do I need to store all vibration raw waveforms as well?
No. Only FFT-extracted features are uploaded from the field. Raw waveforms are stored separately, leaving only a reference key. This is because time-series databases are not suited for reading entire data segments.
What sensors should I use? Are there designated products?
No. Data is ingested via standard protocols, so you can choose any manufacturer freely. If you have existing instruments, you can use them as they are.
Do I need to restructure the system when adding more machines?
No. Rules are attached to profiles, so when adding machines of the same type, you only need to assign the profile. Alarms automatically propagate from components to machines.
Can it be installed on a closed network without internet access?
Yes. It does not rely on online authentication or external communication. For details, see the Security · On-premises section.
Implementation Inquiry

Send us your machine list,
and we will provide a configuration plan.

Tell us your machine types and quantities, along with your current instrumentation status, and we will reply with a configuration plan and estimated schedule. Closed-network installation consultations are also available.

Diagnostic TargetsRotating machinery — Pumps · Motors · Blowers · Compressors
IntegrationMQTT · CoAP · HTTP
InstallationOn-premises — Closed network supported
Contact Email

Including the information below will help us provide a more detailed response.

  • Company name and contact information
  • Machine types and quantities (e.g., 12 cooling water pumps)
  • Current instrumentation status — Availability of vibration/current sensors
  • Need for existing PLC/SCADA integration

Connect your machines

Tell us your machine configuration, and we will send you a configuration plan and estimated schedule.

Contact Us